Summer 2024 - Research Fellowships

An Experiment in Using AI for Cross-Platform App Development

By

During my fellowship, I developed a cross-platform physical therapy app to provide accessible, customizable solutions for athletes and individuals managing chronic injuries. I focused on learning Flutter and Dart to build the app, starting with a Minimum Viable Product (MVP) that included hard-coded routines, a simple user interface, and data handling capabilities. 

Summer 2023 - Research Fellowships

Making an Enigma Machine

By

This summer I aimed to build an Enigma Machine; an encryption machine used by the German military to encrypt and decrypt secret messages during World War II. The machine was made to work mechanically when it was made for the first time in 1918. Our implementation uses an Arduino microcontroller to control the circuitry of the rotors as well as parts of the plugboard. Furthermore, the design has a user interface with a keyboard and a digital display that allows the user to change the settings of the machine.

Algebraic Starscapes Using Complex Eigenvalues of Bohemian Matrices

By

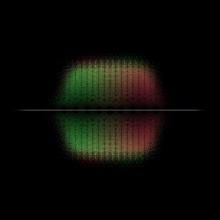
The fundamental theorem of algebra states that every polynomial equation with complex coefficients has complex roots. These roots can be mapped on the complex plane, resulting in beautiful, geometric patterns called algebraic starscapes. I developed python code to compute and graph the complex eigenvalues of specific families of matrices, utilizing St. Lawrence's supercomputer for the millions of computations this required. I experimented with matrix size and integer inputs, as well as a multitude of variables in the graphic generation phase.

Summer 2022 - Research Fellowships

Using Deep Learning to Identify Animal Species in Game Camera Images

By

The goals for this project were to train a convolutional neural network to be able to label game camera images taken in the North Country. Once trained the hope was to use it for Nature Up North projects that involve labeling thousands of images taken each year. Currently these images are labeled by volunteers and this network would be able to at least help sort them faster. At the conclusion of my project, I was able to train two networks – the first sorted images based on any animal presence, and the second sorted images based on animal species.

Denoising Protein Images with Deep Learning

By

Ferritin is a kind of protein that exists in the human body with a mix of two different types of molecules called H and L. Diseases such as anemia, cancer, and Alzheimers have been linked to the malfunction of Ferritin in the body. Therefore, research is being conducted to further understand how Ferritin works. We have 2D images of Ferritin, which thanks to a software called Cryo-EM, can be combined to form 3D models of the protein. Unfortunately, the pictures that we have are blurry.

"You're a [Data] Wizard, Harry!"

By

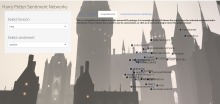
The research conducted for "You're a [Data] Wizard, Harry!" was done through the program of R. Through R, we started with text mining and cleaning of the first Harry Potter film script. From this script and data, we conducted many sentiment analyses for the course of the film and for each individual character. We then applied the sentiment analyses to networks, working to understand the sentiment of dialogue interactions and relationships. Through these analyses, we were able to see the overall connotations for each relationship's dialogue in the first film specifically.

The Interaction Between Mental Health & Positionality in Literature

By

In this research project, I analyzed and visualized the interaction between positionality and mental health portrayal in literature utilizing data science techniques coding with R. Specifically, I looked at about 40 YA fiction novels dealing with mental health issues and comparing those with black characters/authors to those with white characters/authors, as well as looking at differences in gender and the impacts of intersectionality.

What Characterizes a Winning Combination? Network Analysis using Sports Data

By

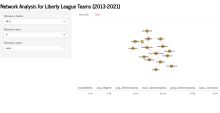
Network analysis is the process of analyzing the structure of a network through graphical and statistical procedures. In other words, network analysis looks at how a set of units (nodes) are connected to one another through directional or non-directional links (edges). For my research project, I explored network analysis and investigated through statistical methods how the directional relationship of assists to goals influences winning percentages for Division III Liberty League soccer teams from 2013-2021.

Assessing Water Bottle Filling Station Use on St. Lawrence University Campus in Relation to Illness during the COVID-19 Pandemic

By

This project analyzed data from two surveys that I completed in Spring 2021 and Spring 2022 concerning the water bottle filling stations on St. Lawrence University campus. Our goal was to determine students' perception of the filling stations through various questions concerning their role in preventing single-use plastic bottles, as well as the filling stations' cleanliness, maintenance, and water quality.

Sensor Data Transplantation for Resilient Drone Operation

By

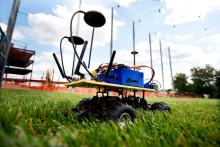
Drones are uncrewed vehicles that operate under the direction of software running on a “flight computer” – a computer that controls the drone as it travels along a pre-programmed path. This research dealt with  increasing the resiliency of the drone in the face of computer failures. We developed a method for transplanting certain sensor data from one flight computer to another, allowing a backup computer to take over the job of the flight computer while the problem is fixed.

Summer 2021 Project Showcase

Using R Studio to Explore 40 Years of Winning Results: The Statistics Behind the New York Lottery

By

How does the lottery drawing system work? Is it true that the winning numbers, as well as each individual digit, were chosen at random? This project uses R Studio to investigate two of New York’s most popular lottery drawing games to see if the numbers picked are as random as the Lottery Commission claims. This was achieved by applying Chi-Square of Goodness test to determine p-values and identify whether or not there is evidence that the numbers are not drawn randomly.

Sentimental Analysis

By

To what extent has the portrayal of mental health in English literature evolved over the past century? I utilized R to perform data science analyzation techniques on fiction novels about mental illness that range over the past century. The current final data includes the full analysis and visualizations from eight novels, but thanks to the successful completion of the R code template, many more books can be added as applicable. The final R document allows the uploading, cleaning, and formatting of the texts of the books.

Summer 2020 Project Showcase

Detecting Real Disasters through Twitter

By

The problem with “Tweets” is that sometimes it is unclear whether the words are actually what writers want to express. For example, a person called Anna K tweeted: On plus side look at the sky last night it was ablaze. The word “ABLAZE” here does not really mean “on fire.” It metaphorically suggests that the sky is so bright as if it is on fire, but it is certainly not a real disaster. Humans can easily identify the real meaning of this tweet. Our goal is to build a statistical model to allow a computer to predict if a Tweet is about an emergency.

GreenCafe Website

By

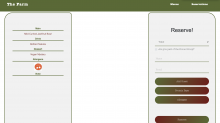
The Greencafe website would allow the Greencafe staff to create events and would allow customers to reserve seats. This website would also allow customers to access the menus. Most importantly it allows the staff to manage all the reservations accordingly. They are also able to send invitations and reminders to their customers.

Creating a “Musician” by Deep Learning

By

This project is to create computer generated music and to make comparisons between the two deep learning models. One is the LSTM (long short term memory) model and the other is the MuseGAN (generative adversarial network) model. MIDI and npz are two forms that are used in each model for datasets. MIDI is a form which people use to process music with programming because it can be easily read by computers. Npz files are able to group numbers into arrays, then save them in the files. It is a form made by numpy package in Python.

An Analysis on the Importance of the Serve in Professional Tennis

By

This project is an attempt to provide an analysis of the serve in professional tennis and its association with win probability. We completed extensive data exploration and wrangling to both find important trends and to shape the data into usable forms to build models. The final model is a Bradley-Terry model that focuses on how first serve percentage (percent of times the first serve is made) is associated with win probability for different players.

Exploring Mathematical Models of the Transmission of COVID-19 and the Efficacy of Different Management Strategies

By

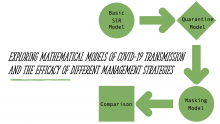
This summer, I worked on a project titled “Exploring mathematical models of the transmission of COVID-19 and the efficacy of different management strategies” with my mentor, professor Rebecca Terry. My goal is to understand how coronavirus spreads within a population and explore how different factors affect transmission. Based on this exploration, I aim to consider how different management strategies may affect the spread of coronavirus through the population and compare the efficacy of different management strategies, such as quarantine and mask wearing.

Music and Emotion in Shiny

By

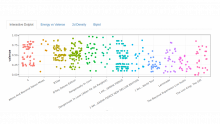
The end result of this project is a Shiny web app which generates four different visualizations of musical data. The data source is the Spotify API, which is easily accessible and provides data for many different artists. The Shiny app allows the user to type in whichever artist they want. First, they will see a simple interactive dotplot of the valence of an artist’s body of work. Valence, a variable used in all of the plots, is a measure of musical turbulence, which allows the user to interpret if a song sounds stable or unstable.

Using Deep Learning to Detect Fake Images

By

Camera quality on smart phones has been improving rapidly along with facial recognition technology. Photo and video editing apps have become increasingly popular and sophisticated. As people use these apps for entertainment, this has also raised concerns about how fake but realistic looking videos may sow confusion, uncertainty, and doubt about the veracity of images. These manipulated videos and other digital representation produced by artificial intelligence are called “deepfake”.

Statistical Analysis of the Representation of Women in the US Television Show, the Office

By

The Office was a culturally influential American comedy show that followed the lives and office interaction of a group of paper company workers, both male and female. The original research questions for the project were: “What is the balance of gender dialogue for each season and the episodes within each season?” and “What is the balance of character complexity for men and women throughout the series?” By exploring these topics through the lens of this show, the goal was to identify possible similar trends of gender representation across the entertainment industry as a whole.

Injuries and Playing Surface in the NFL

By

Football professionals are always concerned about injury due to the high level of contact within the sport, but non-contact injuries are often overlooked. This summer, I attempted to investigate the relationship between non-contact injuries and their relation to the playing surface a player was injured on. The data was provided by the NFL on a site called Kaggle, which is where companies will put out their data for data scientists to analyze. The data was provided in three separate datasets, which would have to be combined to make a complete analysis.

Data Visualization for the Admissions Office

By

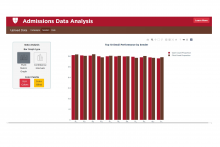
The Admissions Office at St. Lawrence University reaches out to students through email campaigns throughout their application process for reminder, yields and general communication. Understanding the effectiveness of an email campaign and its reach allows outreach teams within the office to develop content more tailored to the needs of the recipients. The project consists in creating a data visualization web application that takes data from the Admissions and Financial Aid Customer Report Management System to create graphical representations of campaign metrics.

Special Cases of Crossing Numbers

By

During my fellowship, I studied crossing numbers of graphs, which are the number of times edges in a graph cross in a drawing of that graph. This idea was first worked on in 1944 by Paul Turán and one way it is applied is to plan roads in a city or rails in a storage yard. Most crossing number work done has been with complete (Anthony Hill) or complete bipartite (Kazimierz Zarankiewitz) graphs. I mainly worked with the crossing number of the generalized hypercube graph, focusing on the rectilinear crossing number.

Mathematical Art and Artistic Mathematics

By

Though each discipline tends to be regarded as the antithesis of the other, mathematics and art intersect often and with fascinating results. This junction appears notably in the works of M.C Escher, a Dutch artist who, despite his incredulity in having any mathematical prowess, developed his own ideas of plane division which would appear in his tessellations. These tessellations would inspire his interest in what mathematicians call plane crystallographic or wallpaper groups, which are classifications of wallpaper patterns, or two dimensional repetitive patterns.