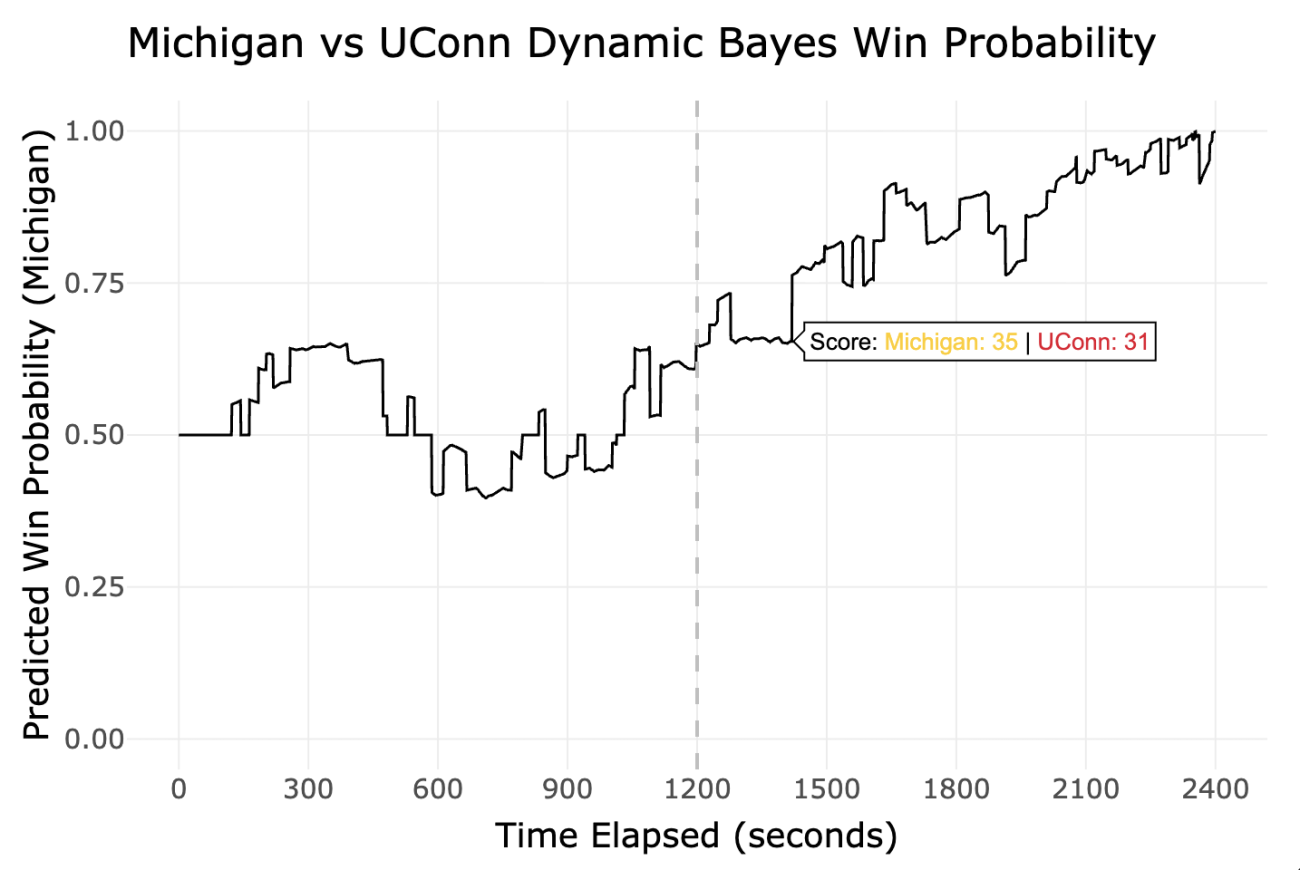


My fellowship project examined how statistical models can be used to estimate and visualize a team's chances of winning throughout a game. Using play-by-play data from NCAA men's basketball games, I collected, cleaned, and analyzed data to build several win probability models. These included frequentist and Bayesian logistic regression models as well as maximum likelihood estimation and Dynamic Bayes approaches. By comparing multiple modeling techniques, I explored how factors such as score differential, time remaining, and team strength influence a team's probability of winning at different points in a game.
In addition to the modeling component, I focused on communicating the results through data visualization and storytelling. I created win probability plots that tracked how each game's expected outcome changed over time and used the Quarto Closeread extension to develop interactive scrollytelling visualizations. These tools allowed readers to interactively explore key moments within games. Through this project, I strengthened my skills in data collection, statistical modeling, programming in R, data visualization, and technical communication. The experience provided valuable insight into the complete data science workflow and reinforced my interest in applying analytics to sports related topics.