

Alexander K. Stewart, USA (ret)
Support
ArcGIS online (AGOL) has a variety of basemaps to use for remote visualization and analysis. With
numerous basemap options, choosing the best for data collection is fundamental. Different types of
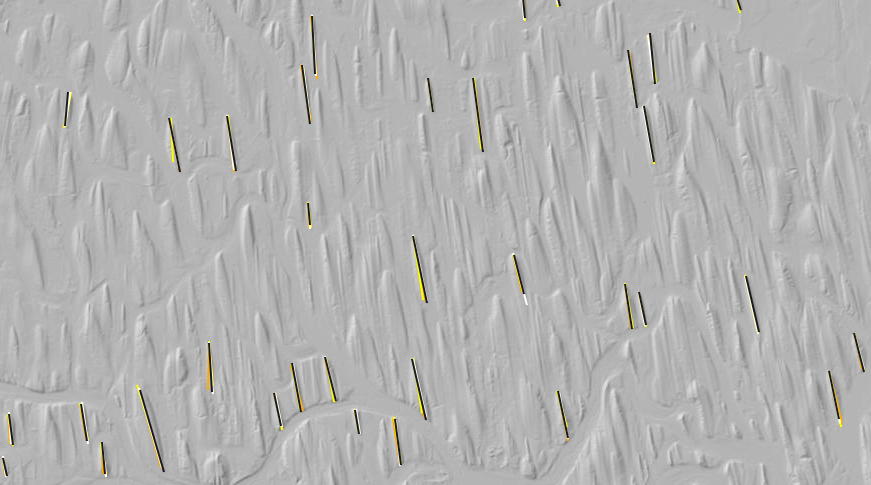
basemaps may affect how we perceive three-dimensional objects (Phillips et al., 1975); thereby, affecting the precision of data collected. This project focused on the length and azimuth data of 60 drumlins in Western, NY from four different, AGOL-provided basemaps: a) USA Topographic, b) default hillshade, c)
Terrain, and d) USGS Topographic. In addition, we generated two parallel-to-strike and two
perpendicular-to-strike hillshades (n=4) to evaluate shading effect on data collection. Data extracted from
line drawings (n=480) was used to calculate the mean length (1,662m, ±529) and azimuth (171°, ±0.3).
Testing these data for uniformity across basemaps determined if any basemap is less reliable for data
collection. Two sample t-tests and linear regression tests were used for comparison. The results showed
no significant differences between the length or azimuth data from different basemaps, but the Terrain
map showed the lowest statistic values, particularly versus the hillshade from a direction of 351° (t(59) =
1.84, p = .007, R2 = 0.4116). At 351o, illumination is parallel to the long axis of the drumlin, hits the non-tapered
end and causes the tapered tail to visually disappear into the shadow. When using a hillshade map
to analyze asymmetric landforms, a poorly selected direction of shading may be less accurate for analysis
due to the visual loss of part of the landform. Seeing the entire landform outline is critical for
measurement data. The USA Topographic map, which has defined outlines of landforms, was best for
data collection and had the least number of differences versus the USGS Topographic map (t(59) = -0.01,
p = .992, R2 = 0.9412). While there are benefits to using hillshade maps to visualize topographic relief,
the more traditional USA/USGS Topographic map is better for measurements of length and orientation
due to the more established outline of landforms and less visual variability. USA/USGS Topographic
maps have historically been, and continue to be, the standard, reliable basemap for many fields, and,
shown by the results of this project, may be the best option for remote measurement and analysis.